
This project aims to design, prototype, test, and build, a "Water Node" for the watering of 2-5 year old trees in the summer months in order to "break the drought" and improve tree survival rates. European trees don't have the hardiness of native trees in the Western Australian environment, but will in theory be able to support themselves once they break into the water table. The Water Node is a product for automatically watering trees between December and the end of February, feeding them approximately 2L/day. It was initated as the highest priority, and therefore first, Farm project on a blue gum plantation near Albany. It is built around the idea that 1000L containers are cheap and easy to obtain, and would form a good basis for such a system.
Next actions:
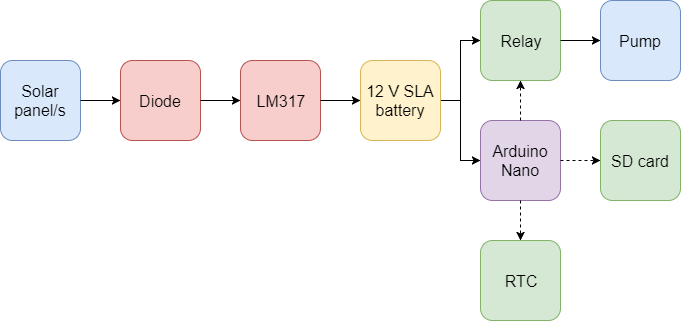
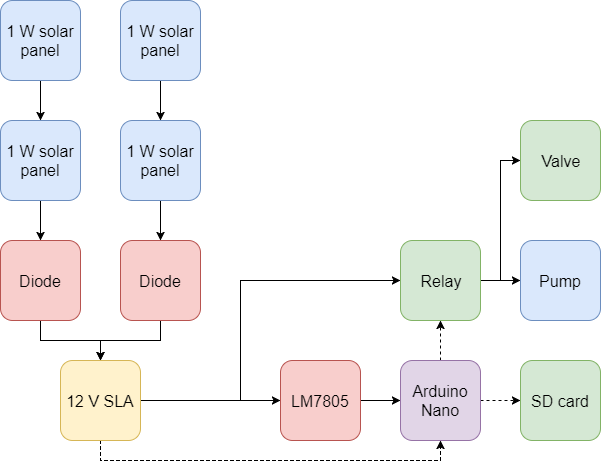
A fair amount of design work has been done for this project already, and I'll do my best to document them now. At it's core, trees must be watered. The easiest and most efficient way to do this is with drippers. Pressure compensated drippers will also give each tree the same amount of water, largely independant of tree altitude/pressure, which means I don't have to worry about monitoring the water flow to individual trees. However, to get the full benefits of a pressure compensated dripper, relatively high pressures are required, which means either very high and unwieldy gravity feed structures, or a pump. The problem with pumps is then the power they require, which must be supplied to them off the grid. A suitable battery must also be selected in order to water the trees efficiently, since cheap energy harvesting should be done slowly over the course of 24 hours.
The design considerations can be expressed in the following tree diagram:

The required pressure and flow rate relies on 3 other factors:
Firstly, the characteristics of the sprinkler heads and pipes determines the pressure to flow rate relationship. Secondly, the slope of the farm determines the average gradient that the system must be designed to function in. A steeper farm means higher pressure differentials, which will affect flow rates. Thirdly, the water requirements and limitations determine how many trees are being serviced, how much water is required per tree per day, how often the resevoir can be refilled, and the size of the resevoir. It also includes the effects of water level in the resevoir on pressure at the pump side.
After collecting all of this information, a range for the required pressure and flow rate can be produced, based on different design choices regarding the irrigation layout and the sprinkler heads.
The next three design considerations are heavily interlinked, and must be considred together.
After determining the pressure and flow rate characteristics, the pump/s can be chosen to match the requirements, while trying to minimise cost and power consumption.
The battery must be chosen to have a high enough power output and energy storage to supply the pump, while also being capable of charging from the energy harvester. It must also minimise cost.
Lastly, the energy harvester and charging system must be capable of harvesting enough energy in a day to supply the pump, create an output V/I suitable for the input of the charger, create an output V/I suitable for the charging of the battery, while minimising cost.
The design must also consider reliability (the device should always work, failure to do so could result in loss of tree life), cost (the design must be cheap to build and run), life (the design must be able to service mutliple generations of trees), and ease of installation (must be able to install this on site without any specialist knowledge, and procurement and manufacture should also be kept as fast and simple as possible).
Requirements were drafted, checked over with the client, and edited. They are shown in the Project Management section. A quick analysis of the requirements:
Some design decisions have been made so far:
A rough schematic of the design follows:

A number of tests will need to be conducted to make design decisions:
In order to complete all of these tests, some purchases will be required.
A few purchases have been made for the tests required to make design decisions:
There are also some future purchases on my list:
Next actions:
There are some skills I need to learn, including but not limited to:
Most of these skills I will learn along the way. The only two skills I will have to specifically learn are the head loss calculations and the battery charging system design. However, there is no need to learn them until more tests have been done in order to better understand the parameters of the system that I'm creating.
Another purchase has been made:
I can't really go about allocating weekly time on this project until I have properly defined my time availability this semester. I have set a reminder to allocate time in a couple of weeks.
In terms of deadlines, a design, including a working prototype, must be ready for next summer. Ideally, it should be be ready before this date, to allow multiple units to be ordered, built, and installed, though in practice it is likely that only 1 unit will be required in the first year. Therefore, the goal is to have a tested proptype built by 2017-11-01, to allow a 1 month window for installation.
There are a few milestones to be completed, and tentative soft deadlines have been proposed for their completion:
To facilitate the next milestone, a test rig must be designed and built to test different types of dripper over a range of input pressures. An initial design follows:

These items are all either: easy to aquire, being sent via eBay, or owned. The next major step is to begin colleting a range of drippers for testing, and buying plumbing fittings for the easy connection of parts.
I was just reading about irrigation system design, and I was reminded of the problem of unfiltered water in the pumps. A filter will have to be introduced to prevent clogging.
Next actions:
Still a few more items to wait before until action can be taken. Priority one is the dripper testing, so I'm waiting on:
These items will probably arrive sometime in late February or sometime during March. April is the (hopefully) extreme outside, though technically possible.
Next actions:
Still waiting for some items to arrive. Some might be at my old house, I will chek on Monday. Mistakes may have been made with the slow procurement of a critical path item. I might actually buy a second one right now from a local vendor to save a little time.
I've had some thoughts regarding measuing the water levels in the containers. First; does it need to be measured at all? If I measure it, then I would have better calculations for the back pressure on the pump, but I have not yet measured this effect, and it may not be significant in a 1m tall container. It might be useful to measure to relay back to the server for status, but the farm server has not even started to be developed officially. If I really do have to measure it, there are two main ways:
It looks like I'm going to be waiting a long time for this pressure gauge, so I should probably design the rest of the test rig and fit it in when it arrives. Annoying, but I do have time until my soft deadline in May.
Next actions:
I've been waiting for a while now, and some of the stuff has arrived in the mail: the solar panels and the pressure reducer.
Next actions:
So, I went to Bunnings this morning, and I hard a hard time finding a fitting to connect to the pressure reducer. This means that I still don't have a working adjustable pressure reducer for use in the test rig. I either need to make an adjustable pressure reducer, or I need to find a way that I don't need to characterise over different pressure levels. I could avoid characterising over multiple pressure levels if I knew the characteristics of the irrigation feeds themselves, including the sprinkler heads. This is virtually impossible, I think. I don't know the next step. One option is to MAKE an adjustable pressure reducer.
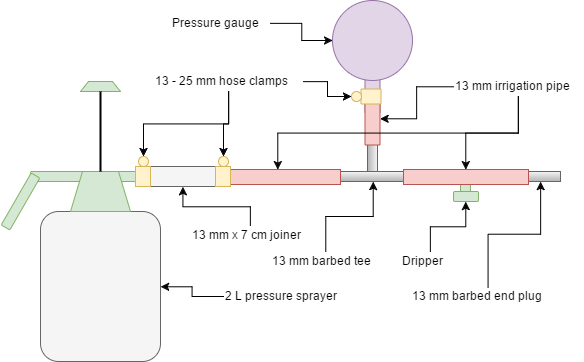
I've designed an adjustable pressure rig. It was based on an idea I had a couple of months ago, pictured below:

A few items need to be bought in order to create this. A list of required items is below:
So, I know where to buy the remaining items, and am reasonably confident about the design. The next step is to walk into Bunnings and see what is available.
Next actions:
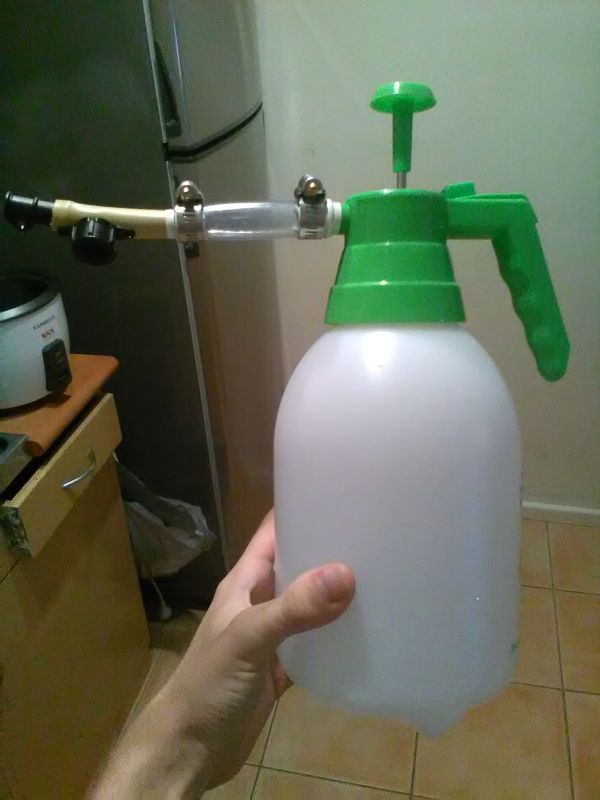
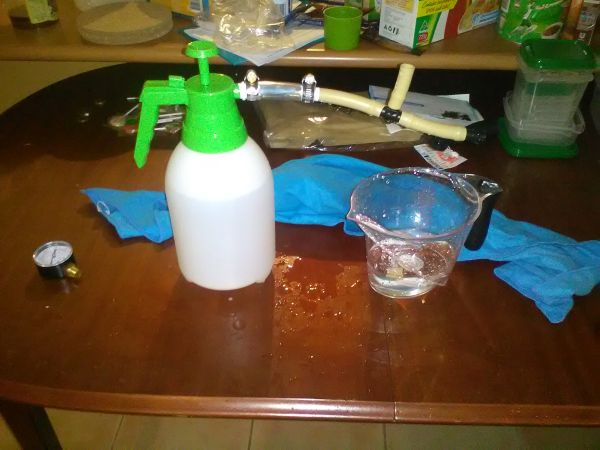
I went to Bunnings, then found a garden sprayer which seemed to simplify my design quite a lot, in that it contained both the pump and the pressure vessel. Then it was just a matter of adapting it to accept my pressure gauge and the dripper fitting itself. The total bill was $29.40, with the bulk of the cost ($16.94) made up by the Holman 13 mm x 25 m drip irrigation tube. A new design follows:

Shown in purple is the pressure gauge and the 13 mm - 1/4" adaption. The gauge has yet to arrive, and the 1/4" adapter will likely be a custom fitting. I have no idea if this container will be good enough for generating reasonably high pressures. This remains to be seen.
Next actions:
A new gauge was ordered for $7.50, to race the other one here. I don't know which will arrive first. Luckily I still have exactly 1.5 months to finish this phase of the design; I might need it.
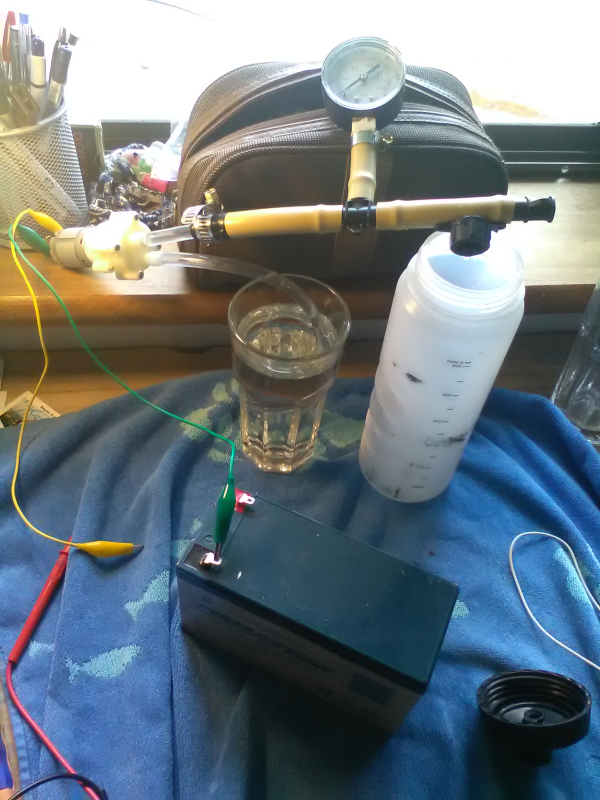
The 13mm pipe was cut with a stanley knife, and the test rig was assembled. Water was added, and the chamber was pressurised.
The good news is that the concept seems to work quite well. The bad news is that much better sealing is needed. Also good news: the frequency of dripping might be a good indication of flow rate. After creating tighter seals using electrical tape, the experiment was repeated with success. The dripping was timed, and after 3 minutes of streaming drips, it turned into a distinct drip. It kept dripping after the 5 minute mark, at which point the experiment was halted.
To automate this testing, pressure and flow rate need to be measured. Pressure can be measured directly by inspecting the pressure meter, when it arrives and is fitted. Flow rate can be measured indirectly by measuing the rate of change of volume in the graduated cylinder.
However, this may not be enough. This process might need to be automated to save time. Will automating the process save or waste time?
OK, so I have determined that automating the testing will save time. I need to draw up a revised timeline for this phase of the project (the next 6 weeks)
Next actions:
Today I designed the automated testing rig. The simplest version I can find uses "Multi Webcam Video Recorder" to take still images at custom time intervals. I'm not certain if the free version of their software will work with multiple webcams though, so I'm stuck until I can borrow a second.
Another possibility is to view the video from multiple webcams on a screen, and then capture the video automatically.I found some freeware for viewing camera feeds (http://www.bustatech.com/webcamviewer-a-simple-viewer-for-webcam/), and loaded up trusty CamStudio (http://camstudio.org/) to do the screen capture. Viola! I have set up CamStudio to capture images at intervals of 5000 ms, and record them as a 1 fps video, allowing for easy transcription. Ultimately this will probably have to be reinstalled on my desktop PC, but that's not too important.
I'm now starting to think that this might not be the best solution. If I were to use MATLAB, I could perform screen captures and save files with proper timestamps, which would make transcription much easier.
Test mthodology
Next actions:
I created a quick 6 week plan for sompleting Phase 1: "Characterised drippers, pressure, and flow requirements":
Objectives
PROCUREMENT AND PREPERATION < 4 weeks
EXPERIMENTS ~ 1 week
DATA ANALYSIS < 1 week
TOTAL = 6 weeks
This helps to identify my next required decisions pretty easily then.
I also designed my testing rig: the current physical testing rig, plus a couple of webcams connected to my desktop PC, running MATLAB, taking regular image captures from both cameras and saving them to the hard drive. Then, I will later transcribe the results into tables for data analysis.
Note to self: With regards to pump testing (that's either testing pumps, or testing with a pump): it would be nice to have a pump to 13 mm adapter for testing the pump itself. Note that the only way to change pressure/rpm is to adjust voltage or current, not sure of best way to do this. Perhaps PWM really is OK. This will be fine if I use an SSR.
Next actions:
I installed MATLAB 2016A, as well as the Image Aquisition Toolbox. Also, the USB devices toolbox which let me use webcams. I knew I was in business when I could run 'webcamlist' and my Logitech 200 appeared.
Next actions:
Well, the pressure gauge has arrived:
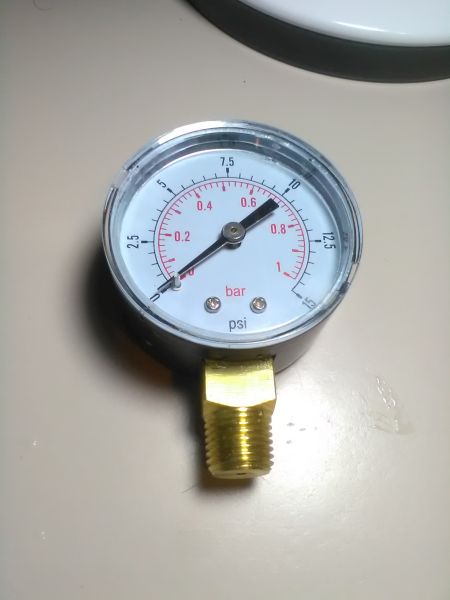
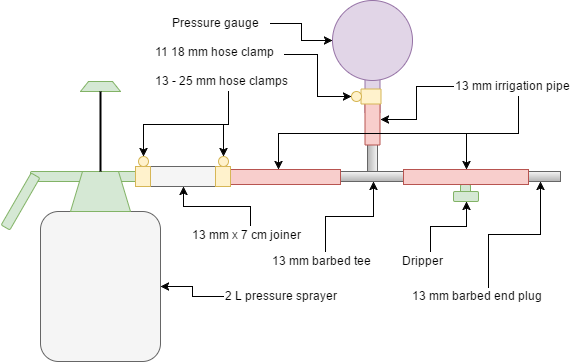
I tried to attach it to my rig, but I will in fact need another hose clamp, see the mess below:
The diagram has been ammended as such:
Late last night, I also did some work on the MATLAB code for the image capture. I managed to get some code working which takes photos from my webcam at regular intervals. Nothing fancy. Still a few improvements to be made before it's complete, but it's functionally pretty much complete.
I was just examining my critical path. I have 2 things which need to be completed before I can start testing: the physical test rig and the code for the testing. Both are nearly complete. I think each could be easily done over a total of 2 days. I think these become my highest priority tasks. I will list them at the top of the "Next actions" list.
Next actions:
I've decided to try and finish the code today. As I understand it, it consists of 3 stages:
The test number can be inferred by checking for tests with the same sprinkler type name. I will use an all caps notation for these dripper names, and I suppose I now need to collect a few more for the testing. The camera names will be declared in the code. The test should produce a folder containing timestamped images in the file format ?-ssss, where ? is a 'P' for pressure data, or a 'V' for volume data, and 'ssss' represents the zero-padded time since test start in seconds. The folder structure would look like the following:
This way, when the files are sorted in alphabetical order, I can quickly work through the pressure data, and then the volume data, for each dripper type.
The code is now complete, and can be found here.
Next actions:
I bought the new hose clamp yesterday, it's sitting on my desk, waiting to be installed. It's the 11 - 18 mm variant, to ensure a snug fit over the 13 mm pipe.
In terms of data analysis, I'm going to get a bunch of data points which correlate pressure to volume of dispensed water. To calculate water flow, I think I can safely use the gradient of the volume changes, and perhaps use a moving average or discrete LPF of some kind to reduce the variance. This is shaping up to be quite a big problem, since an LPF/MA will both create a lag in the result, which may be significant. I will probably have to experiment with different parameters for the filter until I get satisfactory data. The pressure gauge should give fairly precise measurements with an easy to read dial, so I'm not as concerned about this. To make it slightly easier to read the volume, I think I will dye the water blue.
When I have a series of pressure and flow rate points, then I should be able to simply (!) plot these on a scatter-plot and see a relationship. Repeats of these tests should help confirm the validity of my data, and perhaps smooth the results slightly.
Next actions:
Made a small change to the test rig schematic:
Then I added the hose clamp to the physical test rig, and tried pressuring it up. There seems to be a small leak in the gauge itself; you get what you pay for. The dripping from the dripper itself is not great though, in that it can sometime cause splashing outside the container, and also makes the water level hard to read. Perhaps a baffle of some kind could solve both these problems. The measuring container I have seems to fit the bill, in that it has a sloped edge on the inside face.
Next actions:
I don't think it will actually be necessary to move the code to Github at this stage, since it isn't particularly useful. I will label it a 'script', the likes of which will be available on request. At some point I'm going to need to add contact details of some kind on the website.
The webcam arrived, so I am now ready for Saturday's preliminary experiment. A quick check of the timeline shows that I'm still 2 weeks ahead of schedule, which is great. I am on track to complete this phase in just 4 weeks, rather than 6. After I've completed this preliminary experiment, I'll be ready to define the experiment in more precise terms.
Next actions:
So, I was doing some thinking about the long term implementation of this project. The testing and commisioning phase is going to be a little but difficult. For instance, how do I prove that the system is working correctly? Which error conditions do I need to be testing for? How will I relay this information to a useful location? Once error conditions and perfomance indicators have been identified, then sensors can be introduced at these locations in order to check for errors. The information can be stored locally, and this represents the simplest system to implement. However, this system is difficult to monitor. In order to monitor the system, a radio link would be required from the node to a gateway. No radio infrastructure exists currently, and neither does any gateway. Perhaps my solution should allow for future upgrades, by simply including provision for the radio link at the water node end. In the meantime, a simple SD card with an eject button should be sufficient.
I suspect that I will need to test pumps. Not all cheaply aquired pumps come with reliable datasheets. However, the testing for these is simple. My current setup, with an adjustable valve rather than a dripper, should be sufficient for getting a few data points to double check their datasheets.
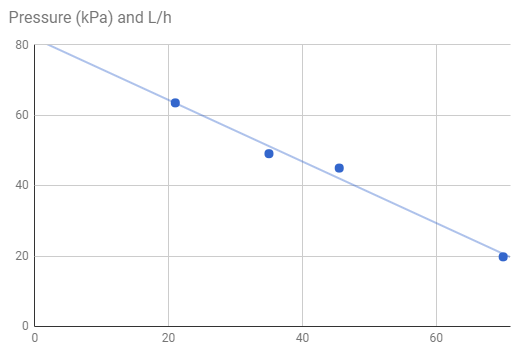
So, today I finally performed an experiment. I recorded water levels and air pressures with a pair of webcams, by taking photos every 5 seconds. Then I went back and transcribed the values into a spreadsheet. Then, I fitted polynomial curves to both sets of data. I differentiated the water level curve to give a water flow curve. Then I created a 2D scatterplot of the pressure as a function of flow rate. All the data and plots are available here. I don't know how accurate this technique is, so I'll perform it a few times and see how my result vary. The reason the results are so smooth is that they have been heavily approximated.
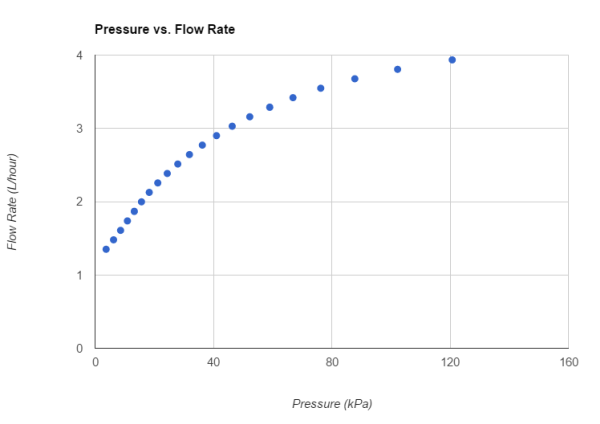
I also had a closer look at the elevation changes. According to this tool, it looks like the worst case gradient is around 5% over a 100m section. Over a 71 m long section from a 5 x 5 tree watering area with 10 m spacing, that would create a 3.5 m elevation change. In a similar 4 x 4 area, that would cause a 2.8 m elevation change. Therefore, that is approximately equal to a 35 kPa variation, or a 28 kPa variation, respectively. The tolerance for tree watering is unknown; I will have to consult with the client. Looking at the initial brief, perhaps 16 trees is best, to give approximately 800 L per month total (plenty of error margin). Nothing is known of the required variance in water/tree/day. For argument's sake, I will assume that the highest flow case allowable is 900 L over a 4 week period with 16 trees, which is 2.01 L/day, or around 61 L/month, 11 L/month above the required amount. Then I will assume that the allowable range is symmetric, i.e. the minimum allowable flow rate = 50 - 11 = 39 L/month. Then, the max/min flow rate = 1.56. The peak pressure difference is 28 kPa. According to the dripper data, if the pressure varies from 13 kPa to 13 + 28 = 41 kPa, then the max/min flow rate is 1.55 ~ 1.56. Therefore, according to the preliminary data, the allowable pressure range is 13 to 41 kPa, causing a variable flow rate between 1.87 L/hour to 2.90 L/hour (max/min ~ 1.55). Therefore, the required pressure at the pump, in the center of this array, is (13 + 41)/2 = 27 kPa. The required flow rate is therefore an average of approximately 2.5 L/hour/tree (roughly), which implies a total flow rate of 16 * 2.5 = 40 L/hour. This equates to 54 minutes of pumping per day.
Questions for the client:
And the outcomes of today's work:
I have just realised that this is somewhat erroneous, since it assumes no head pressure from the pipe system. However, according to this tool, at at the 0.003 L/second flow rate through a 13 mm diameter pipe for 28 m (worst case, this would never actually happen), the dynamic head loss is < 0.1 kPa. In this situation, this is negligable.
Next actions:
Potential problem: the pipes will be holding around a certain amount of water which would drain onto the trees. This isn't ideal, since it would radically increase water consumption. However, if the tank is placed at the lowest point in a water network, then it could drain the water back into the tank after it had finished pumping. To do this, the network would have to be designed specially for each location, which means that heights need to be measured accurately. This could be done pretty easily with a pressure sensor on a stick, I think I can get heights to within a meter or so. In an hour, pressure can vary by around 0.2 kPa, so that equates to around 16 m, which is around 1 m in the few minutes it would take to get the readings. I think this is close enough to be useful, since that corresponds to a worst case. More experimentation needed.
I just finished transcribing the results from experiment 2, and they have quite different results. At least, I think they are. Now I really doubt my method. I think I need to do less curve fitting and more data analysis.
Next actions:
I had a chat to the client yesterday, and they confirmed that the flow/month should be at least 40 L/month/tree.
Next actions:
I've been doing a lot of thinking about this project today. I was talking to the client the other day, and they pointed out that good engineering was about simple solutions. I am no longer convinced that my solution is simple enough.
The main problem with all of my current designs is that the pipes themselves contain water, obviously, and therefore act as resevoirs which allow the trees downhill of the main tank to recieve much more water than the ones upstream (see 2017-04-02). I can only think of a couple of main solutions to this at the moment, including some basic pros and cons;
I think a good exercise here would be to compare them in a table. Fisrtly, relevant requirements were chosen to evaluate against. Then, weightings were applied to these requirements. Scores were calculated for each option. Finally, total scores were tallied.
| R4: Flow | R6: Cost | R7: Ease of installation | R8: Product life | R9: Reliability | Total score | |
|---|---|---|---|---|---|---|
| Tank at bottom | 1 | 2 | 1 | 3 | 3 | 27 |
| Valve switch at tank | 3 | 1 | 2 | 2 | 2 | 26 |
| Weighting | 2 | 2 | 3 | 3 | 3 |
This process showed that neither design is yet a clear winner. More thought is required.
Next actions:
I'm now getting somewhere towards a real solution. Maybe.
There are now 3 general types of solution:
I will continue to investigate more network topologies in order to determine if there are any other obvious solutions. Still no obvious candidate. I think I might just end up using a much more powerful pump and a larger solar panel. The pipes will only end up costing around $50, so I still have a little bit to play with. $100 can buy a decent amount of solar panels etc.
A rough list of errors that could occur during operation:
On another day, I will attempt to control these potential failures.
Next actions:
If I made an assumption about the surface of the ground, i.e. that it could be approximated as an inclined plane, it would radically simplify the solution. I'll include a drawing tomorrow. The process then becomes: measure ground levels, calculate layout automatically.
Next actions:
Well, it's been the best part of 4 months since I last made progress. In an attempt to give the project new life, my dad has threatened to plant 16 pecan trees which will surely die during their first summer on the block unless I am able to complete and commision a working water node.
A new assumption has been set: the ground is flat. This somewhat simplifies the problem.
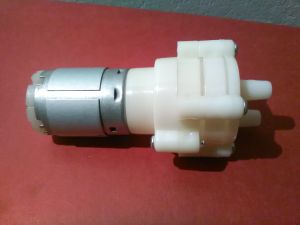
I just did an experiment with the pump I had, and some suitable PVC pipe I found lying around (9 mm OD, 6 mm ID), and it can pump 100 mL of water at over 15 PSI in 1 minute using 600 mA of current. That corresponds to around 6 L/hour at 100 kPa for 7 W. Flow rate is too low, pressure is higher than required.
To do a more realistic test, I'm going to need to use 16 drippers and just see what kind of pressure and flow rate I'm getting with this pump.
Another Bunnings trip:
The drippers weren't cheap, but they can be reused on the first prototype. First I tried the inline tap, and built a very rough pressure/flow rate relationship with just 4 data points:
Then I made up a rig with 16 drippers and performed the same test.
This pump draws around 450 mA at 12.7 V to produce 0.0137 L/s at 38 kPa. Let's compare this to the requiremensts calculated on 2017-04-01 which stated that 27 kPa would be required to account for pressure variations brought about by slopes. This has been achieved. So, 5.7 W will produce 49 L/h at 38 kPa. Working on roughly 1.6 L/day/tree, this gives a watering time of around 31 minutes, which equates to 10.7 kJ, or 40% of a 2000 mAh 18650 Li-ion battery. Awesome news!
Looking back on the design schematic, it is now safe to specify each part and create a proof of concept design.
All together, the cost is $200. This is a little over budget ($160). The main costs here are the pipe and the container. $1 or $2 could be saved on the electronics, but not much more than that. I will present this to the client and see what they think. A good day's work.
Next actions:
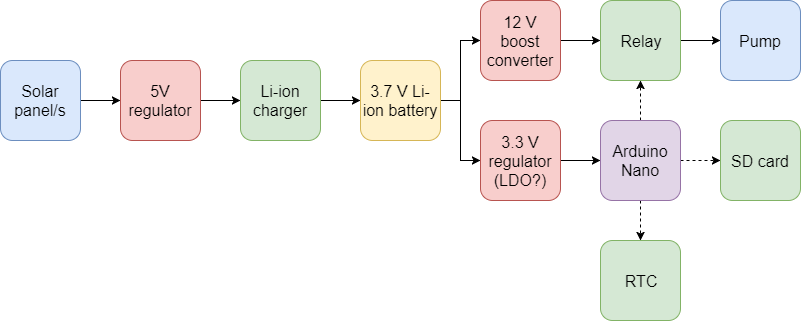
I had a little play with a few parts today. I'm still waiting for my 18650 holders to arrive, and in the meantime I thought I'd check my buck/boost converters. Turns out they're only buck converters. I've ordered 2 boost converters, they'll take about a month to arrive though. I've also decided to stick with an electromechanical relay for the switch, it's the cheapest and easiest option.
Next actions:
I tested the solar charging system. The panels give around 7 V max no load, and can provide between 7 mA and around 100 mA depending on the light conditions, which is actually surprisingly close to the stated values on eBay. The TP4056 charger seemed to be working, but I'll only know for sure once I've tried charging a battery. I'm waiting for the battery holders before I try doing that. One of the LEDs was missing from the breakout board, so I soldered a new one in, but it was too large and may have incorrect polarity. In any case, the TP4056 as I had it set up was trickling 40 mA over an open circuit, and seemed fairly immune to voltage and current changes on the supply side.
I also ordered a LDO 3.3 V voltage regulator and a 18650 battery holder. Hopefully this allows for a (nearly) full test of the electrical system very soon, barring the boost converter (I now realise that I have a spare SS relay). I still need to establish if the 18650 is the correct choice of bttery. I think it's correct, based on it's low voltage (easy for the solar panels to charge) and small size, as well as relatively low cost sompared to an SLA. However, SLAs can be safely and reliably trickle charged, so I don't know if a Li-ion is a necessarily a good choice. Having said that, I'm at the stage where decisions need to be made, so there's no use waiting around trying to be optimal about these things.
Next actions:
The 18650 holder has arrived. So, I can put my "super real" (nothing Chinese or fake about it) 18650 into it, right? Unfortunately, this 18650 doesn't have the protection built in, and is therefore too short, and therefore doesn't fit into the holder. I suppose this is a problem for me to solve tomorrow when I try to test this battery.
I talked to the client about the cost projection, and they seem fine with it, particularly because they believe the final product, if it works, will be worth much more than they had initially budgeted. So, Let's work with $200 for the time being.
The test site has been chosen next to the nursery on the farm. It should be large enough, and it is close enough to a water source to be useful.
A method has been chosen to shange pipe sizes: end caps, drilled tthrough with 6mm holes and sealed with silicon. The flow rates should be low enough to avoid any problems with turbulence/dynamic head.
A filter system will be necessary in order to avoid clogging of the pump and drippers. This can be done in line with the pump, so long as it doesn't create any pressure problems. It also needs to be factored into the budget.
In future, as aluded to in the name, the project may expand to a full "Water Network". This will especially become necessary if there are many Water Nodes, each requiring a significant supply of water.
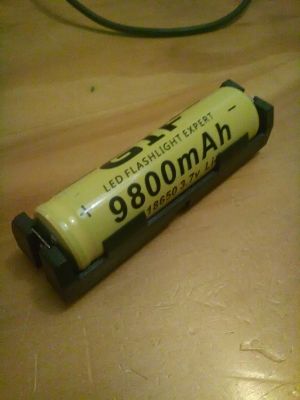
I had a play with the fake 18650 that I have, but I don't trust it at all. I'm still going to try to discharge it, just to test the charging circuit. It seemed to discharge over around 1.7 hours with a 6.8 Ohm load, which works out at nearly 1000 mAh. Unfortunately, it advertises 9800 mAh, and in fact, durung the test, there was a significant amount of internal resistance in the battery which caused the terminal voltage to look a lot more like 2V. Not impressive at all. I'll try charging it tomorrow, but more to look at the operation of the charger rather than anything else. I've just paid for another UltraFire (*perhaps* more relaible?) to be shipped for $10.90 from ausbatteries.com.
Next actions:
The new battery arrived. I'm not sure I trust it much more than the one I had before:
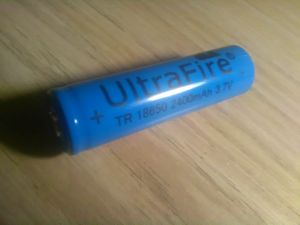
I've decided to test this battery, as a baseline (the other battery seemed too terrible to even bother testing properly). The nominal voltage of the the cell is 3.7 V, and the pump requires approximately 12 V. Assuming 90% efficiency of the boost converter, this means that a 400 mA current in the pump would require around 1.44 A from the battery. For a 2400 mAh battery, that would imply aproximately 0.6 C dishcharge, which is allowable. The battery should be tested at this rate of discharge in order to determine it's capacity. If I were to monitor voltage over time for a known resistance, stoping the test at 3.2 V or so, and time stamping the voltage, I could probably get quite close. Better would be to create a constant current load, and simply time the discharge to 3.2 V, except that would require an LM350 which I don't have on me. So, I'll probably do the easier test, using a relay to engage the load. The only true way to calculate the internal resistance would be to use 2 multimeters measuring current and voltage over a load. I'll settle for a known load resistance RL, and then perform NL and FL tests.
It turns out that the battery wasn't yet fully charged; the cheaper battery holders from eBay seem to have poor connections to the terminals. I'll stick to quality products from now on...
Test results:
This is a high internal resistance. That means nearly a 0.8 V (22%!) drop for a 1.44 A load. Now I need to seriously consider 12 V SLAs, since the cost of a real 18650 might be close to $20, vs. a 7 Ah at around $23. I will investigate this properly tomorrow.
Next actions:
Having thought aboiut this for a few days, I've decided to pursue SLAs. They are safer to store and charge, they are approximately the same price, and they negate the need for a boost converter, since they operate at the same voltage as the pump itself. 4 solar panels in series, running through a power diode and an LM317 tuned for ~14 V (as per this link), should be able to safely and easily trickly charge the battery. The capacity is much higher, so there will be better resistance to variable weather conditions. The component count has been reduced, the price slightly raised, but the reliability of the system increased.
Updated BOM:
All together, the new cost is $212.
Since the boost converter is no longer needed, I can now progress by building a proof of concept of the electronic sybsystem. I tried this today:
The circuit was very easy to make, but I'll need a sunny day to test it. I might run into some issues with trickle charging in general, especically since I'm not really looking after the SLA at all. Still, I can easily make the charging circuit more sophisticated in the future, I think this is fine for the time being.
Next actions:
The test performed today for the Bird Recorder seems to show that this might not be an effective charging system, though more testing is definitely required. I propose a 400 mA load for 30 minutes every 24 hours, in a full field test of the solar system. It's also possible that the circuit is not complex enough to allow proper charging. This needs to fully investigated. It might be easy to solve this problem with a slightly larger solar panel for a few extra dollars.
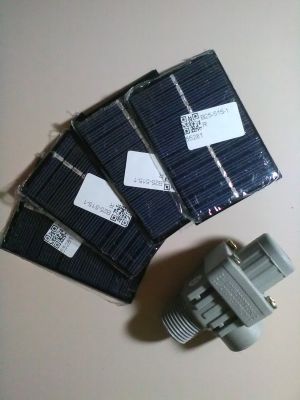
I just bought a 1.5 W, 3 W, and 10 W solar panel. These, combined with my 40 W and 0.6 W panels, mean that I can test a variety of different charging configurations. I also learned that 12 V SLA batteries should be charged with a max current of around 0.25 C. Hence, a 7 Ah battery should recieve 1.75 A max, or around 21 W. This points towards a 10 W panel being suitable for most applications.
| Power (W) | Cost ($AUD 2017) | Economy (W/$) |
|---|---|---|
| 0.6 | 1.1 | 0.55 |
| 1 | 1.59 | 0.63 |
| 1.5 | 3.37 | 0.45 |
| 3 | 8.35 | 0.36 |
| 10 | 21.55 | 0.46 |
| 40 | 46.95 | 0.85 |
As can be seen, the best economy can be achieved with 40 W (and probably greater) panels, but 1 W panels represent good value for money.
Today I made the circuit to test the charger, and also wrote the program. It can all be tested tomorrow.
So, this is all being tested as part of the Bird Recorder, which is the more urgent project at the time of writing. I'll leave the bulk of the work there for the moment, and then I'll try to bring back the learning from that project into this one. Also worth noting though: a battery over-discharge prevention circuit is imperative.
Next actions:
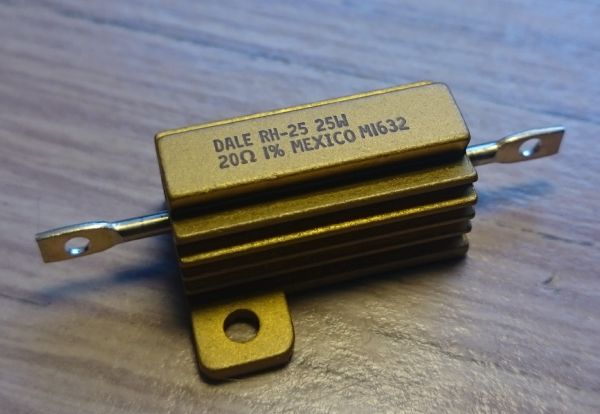
I just bought a 20 W 10 Ohm resistor to use as part of a capacity test/solar charging test with a standard 7 Ah 12 V SLA. The results of the testing from the Bird Recorder project showed that a 40 W panel was enough to power a continuous 100 mA load. However, I didn't have enough time to work out exactly how effectively the battery was being charged, and whether a 10 W or perhaps even smaller panel would be more appropriate in some cases. This will doubtless be extremely useful knowledge for countless future projects.
Next actions:
I was talking to a friend, and they made the point that if the open circuit voltage of the solar panel only maxed out at 14.5 V, then it would be safe to plug directly into a SLA. This could solve a bunch of problems at once. Don't forget to allow 0.6-0.7 V for the blocking diode though. The solar panels keep trickling in, I'll be ready to resume testing once I have the power resistor and a new SLA.
I was reading a bit more about SLA charging, and according to the link, at 50 C (worst case), the charging voltage for an SLA should be 13.2 to 13.5 V. At a more reaslistic 25 C ambient temperature, the charging voltage to should be kept to 13.5 to 13.8 V. I measured the OC voltage of the range of solar panels that I have, results presented in the table below:
| Description | OC (V) |
|---|---|
| 10 W | 21.4 |
| 1.5 W | ~21 |
| 6 V | ~7 |
It seems that the solar cells are built around the same 7 V factor. This means that 2 in series produce around 14 V, which is easily reduced to 13.2 - 13.7 V through the use of a Schottky diode or regular power diode. This diode is essential to prevent leakage current, but I'll need to wait until this afternoon for my new 12 V SLA to arrive in order to test this. Probably would be easier if I had a benchtop power supply... The battery has arrived, and the data on the side confirms a 13.5 - 13.8 float charging voltage.
I need to make some progress on this. What is left to do? My list tells me that there is solar charger testing, but let's come back to that. Assume for the time being that the electrical system is completely solved. So, I need to solve the hydraulic problems. The main things left are the connection between the IBC and pump, and the pump and irrigation pipe. The second can probably be thrown together with sealant, but the first is a little more important. I just bought an IBC to 20 mm adapter for $3.36. It will take a month or less to arrive, so it will still be on time.
Another worry was that the pump would flow backwards under pressure. I'll test this too. After taking it apart (and discoevering that it was more complicated than I thought, and putting it back together) I discovered that blowing into the the input worked, but blowing into the output did not. This suggest that I may need to incorporate a valve. The problem with a solenoid valve is that they commonly draw quite a lot of current, and in this case, it may even draw more current than the pump. One I found on eBay drew 0.6 A at 12 V, when the pump is drawing 0.45 A. If the total were 1.05 A, then the 31 minutes of pumping would be around 0.54 Ah. This might still be acceptable. I need to characterise those 6 V panels a little more, it would be great to know what they were capable of. I haven't been able to characterise them without a second multimeter, which I hope arrvies soon. Maybe I can assume 50 mA @ 6 V. I think this is at least approximately correct. Based on that, and 7 hours of insolation per day, I could expect 2 cells in series to produce 0.05*7 = 0.35 Ah per day, which means that it would be enough to power just the pump, and with 4 cells I could generate 0.7 Ah a day, which would be enough to power both the pump and the valve. I might need to use more to be safe, but even 6 cells is very cheap. This would probably be better/cheaper with 4 x 1 W cells, but they haven't arrived in the mail yet.
In the meantime, I might as well have a play with the RTC. It was easy to set up with this library. Now I can write the basic structure of the program:
[sleep] Go to sleep for a minutewatered == today_date, go to [sleep][sleep]watered = today_date[sleep]If I put the connectors for a screen somewhere on the board, then I could have some kind of display, which would be great for the first version. Come to think of it, perhaps a PCB would be a good start. Maybe I can just hack this together on a protoboard. It might be good practice... Nah, I'll just make a PCB by Monday and get it shipped with the rest. So, I'll have to think about what it includes.
I had better buy that valve. I can always top up my bank account on Monday morning. I ended up choosing one that had the word "gravity" in the title, to convince me that it really could go down to ~0 kPa. It cost $5.89.
Next actions:
The power resistor has arrived. Now I'm just waiting for that multimeter. At least I can test the battery capacity now.
The next step is to work out how many solar panels I need. Without a second charge controller, I'm finding myself trying to hack together a solution using a Schottky diode and a few small 7 V panels. The simplest solution is to combine 2 cells in series with a 0.3 V diode to give approximately 13.5 V, which is a safe charging voltage. The only complicated bit is working out how many sets of these I'll need in parallel before I'm wasting money.I have started conducting an experiment where I measure the effect of temperature on cell voltage for this SLA, which, when combined with the voltage of the cell, should be able to provide me with reasonably accurate SoC measurements given enough time for voltage stablilisation between discharges. It seems like a long bow though, and I'm getting kind of sick of not getting this project done. I'm going to make some leaps of faith and overengineer this for the time being; I can always reduce the number of panels in the future.
As described on 2017-10-06, I need 0.54 Ah per day. After adjusting for charging inefficiency, I need 0.72 Ah per day. 2 panels would provide around 0.35 Ah per day, conservitavely. So, perhaps 6 panels will be enough. If I were using the larger 1 W panels, which can provide 7.3 V OCV and 0.127 A CCC, making them probably more like 0.56 Ah per pair, though the higher OCV is a concern. The diodes I have give 0.2 Vf at 0 A, and probably around 0.3-0.4 Vf at 0.2 A, so 2 cells will result in a (7.3*2)-0.3 V = 14.3 V charging voltage, whih is higher than 13.8 V. I think I might get away with it though, since the charging currents are so low, and the battery will probably completely fold the output voltage. Wow, there are so many experiments to do here. I might have to buy a battery and make a permanent solar installation in order to conduct all of these experiments. I'll add a project in a second. In the meantime, I think I can just assume that this will work and move on. OK.
So, what's left? I guess I need to do a complete test of the electronic subsystem. The battery is currently being used for that temperature/voltage experiment, so I can't really do that. I'll just describe the design for the time being. 4 cells, in 2 strings, each with a diode in series, connected directly to the battery:
I don't think I need to make a PCB for this one. I've been getting a bit excited about PCBs, and they actually cost a littly bit of money. I think this would be a good time to learn how to use protoboard.
I whipped together the solar panels and diodes, and am getting the 14.3 V I was expecting. Now I just need to plug it all into a battery, add a dummy load on a relay, and give it WiFi...OK, let's pare this down. What I might do is leave it plugged into the battery for a full 12 hour day tomorrow and see how much the voltage increases. Then, I could plug in a 1.05 A load for 31 minutes to simulate my expected load, and see what the voltage drops down to. If it's greater than it was, I know I've got enough power. Simple test. Why didn't I think of that before. Best of all, it doesn't require any voltage monitoring. I will need to be able to adjust for temperature though, so the test I'm currently performing will be important.
With my 20 Ohm resistor, then 0.54 Ah is approximately 50 minutes at 0.65 A. Close enough.
Next actions:
A couple of days ago I plotted cell voltage vs. temperature, but didn't see any releationship:
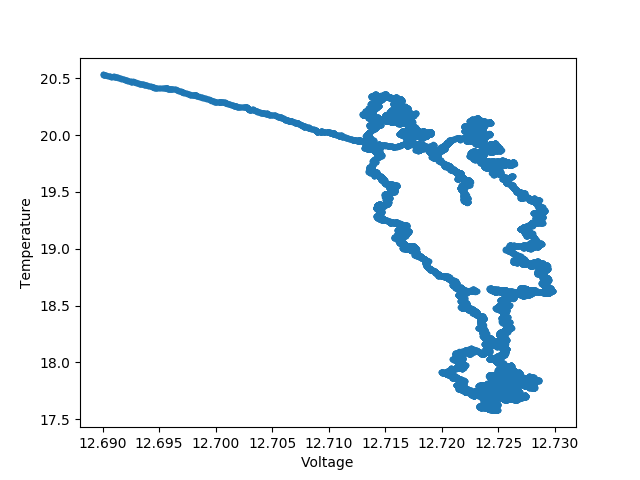
Unexpected, but useful. Then I looked at the transient response of the battery voltage to a load. I saw some nice exponential curves for a load of 20 Ohm, looks like a friendly first order transient response:
The main outcome of this is that after some time period, the voltage reading of the battery can be trusted. I just need to work out how long is required, and I'm all set. Unfortunately there are no time units on the x axis of the graph, and since I'm already running the next experiment, it's too late to change it. I'll have to settle for a scaling factor in post production: approximately 3:10:00 will have passed when I disconnect the load.
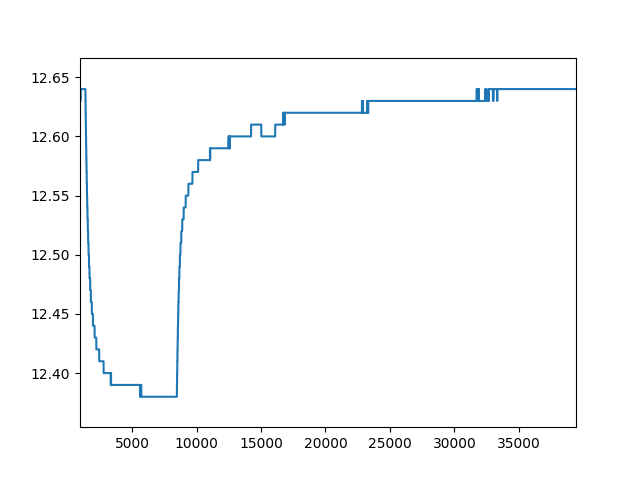
And, just for fun, I touched the load and burned my finger. Lesson learned: don't touch hot things. I'll probably never, ever make that mistake again in my life. Probably. I put it on an upside down saucepan which is acting as an effective heatsink.
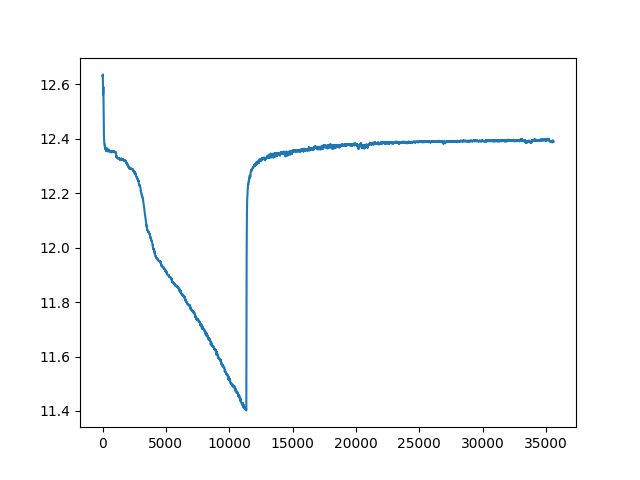
So, it appears that the battery started at 12.67 V, dropping around 0.58 A, dipped to 11.42 V (now around 0.53 A) after 3:10:00 (also rising by ~1.5 C in the process) and then rising back to 12.41 V after approximately 5 hours. In theory, dropping 0.58 A for this long would imply a discharge of around 1.84 Ah, around 25.5% of the battery capacity. Using linear interpolation from this website, it seems as though the battery has fallen from 84% to 59%, a drop of 25%. So, it looks like everything is on the money! More testing would confirm this, but I'm happy to trust the numbers for the time being. This is an extremely promising result.
The other result here is that by waiting 5 hours, the cell voltage has enough time to stabilise. After 17:24, it reached 90% of the final voltage. After 00:20, it reached 50% of the final voltage. Hopefully I get the chance to test this more closely in future. However, it's nice just to know that I can wait 5 hours for loads less than 0.58 A.
Tomorrow, I'll connect it up to the solar charger and see what a day's worth of charge can provide. Estimate as above on 2017-10-20, which gives a 1.12 Ah charge, resulting in a theoretical final 59%+1.12/7.2 = 75% charge, so, I'll estimate a final voltage of 12.6 V. Let's wait and see!
Next actions:
Well, the charger was deployed without incident. At the end of the day, it looks like the battery voltage is satble around 12.58 V, which implies 73% charge. So, that was another pretty close guess! I'm willing to trust all the numbers I've gathered so far.
The useful takeaway from this is that a pair of 1 W panels in series with a Schottky diode can produce around 0.5 Ah of charge in a day, and 4 can produce ~1 Ah (~14% of a 7.2 Ah AGM), which is enough to keep the battery topped up with the load I've described. But, I'm getting a little worried about overcharging again. Technically, this array could generate more like 14 V, even after the voltage drop of the diodes. That is definitely too high. To what extent will the voltage be collapsed by the battery? Will power dumping be required? That might actually be quite an elegant solution to keep the voltage down. Alternatively, 0.6 V power diodes could be used to drop to 13.8 V, which is still a little on the high side.
At least I know that this setup is appropriate and sustainable, as long as I can control damage to the battery.
Next actions:
The IBC 13 mm adapter arrived, as did the valve. Now I'm free to test the valve's current consumption (though a quick calculation shows that it's probably using just over 0.5 A, which is close to the stated 0.6 A), and then I think I might even be ready for a full system test. I just realised I might need a few more RTCs though: I just bought 4 for $3.10.
The overcharging problem might not be such a problem. If I change the diodes for regular power diodes, I might lose a little efficiency, but the voltage will be brought down from 14.3 V (raw output of panels, with 7.15 V per cell) to 13.55 V (~0.75 Vf for this diode at 100 mA), which is definitely OK. I just need to make sure the diodes I have are rated for the ~ 100 mA they are required to carry. Yeah, they're rated for 1 A each.
I drew a quick picture which I can't upload due to my poor, shaped, internet speed. It turns out there are only a few elements remaining:
1) to 5) can be done in a shopping trip in town. 6) requires a quick test. 7) requires some more complicated testing. Perhaps I can just buck it down to... 9 V for the time being, and that way I know everything will work, though it will lack some efficiency.
It turns out that the measured current consumption was more like 0.4 A. I would say that the figure lies a little higher, due to the impedance in the multimeter wires. Let's go with 0.5 A. So, (0.5 + 0.45) * 31/60 = ~ 0.5 Ah per day of power consumption. Cool!
A friend of mine makes the point that, often, the pwer lost to leakage current through solar panels can be less than the power lost through the diode during charging. Worth investigating at some point.
Next actions:
I've brought back the IBC from the farm, turns out that not all 60 mm threads were born equal. I should be able to jam it on regardless, but it's a bit annoying that it isn't standard. I also bought a few connectors from Bunnings to get everything working.
Next actions:
I connected up the pump and valve in series with a car battery, and connected the hydraulics inline with the IBC. It seems to work pretty well! I would like to check to see if the system can work without the valve, and also it would be good to waterproof the connections I've made a little better, I'm getting air bubbles. One trap to avoid: make sure your valve is pointed the right way. Turns out that they kind of have polarity. I'm guessing there's a one way valve somewhere in the system. Running it through the drippers was giving me 5 PSI, which is a little lower than I was expecting, but only around 10%. This might be party to do with the drained state of the battery I'm testing with. In either case, the only thing which I'm not satisfied with at the moment is the IBC connector itself, which has the wrong thread count. It looks like a ~5.75 mm thread, with a 63.75 mm diameter. So, according to this website, I probably have a S60x6 / DN50 type valve, but bought a 2" BSP type valve. Whoops. I've ordered something more appropriate (and expensive!) to hopefully arrive in time.
To test the effect of the slope on the flow rate, I'm going to need to set up 8 drippers on the top and bottom sides of a slope. So, I'll need a T connector, and a bunch of pipe. I wonder if I already have enough... I have enough pipe, but I think I'd like to keep that T section where it is to monitor pressure. I think it might help me diagnose pressure differential problems as part of this next test. i know that I have a spare end cap, so I won't need that.
I need to make another road map. Let's see how I'm performing based on my previous goals... Since I have characterised the sprinklers, calculated the farm slope, working out the water requirements and limitations, determined the required pressure and flow rate, chosen an appropriate pump and battery, and characterised the energy harvester and charger, the design is functionally complete! It must be time to put everything into a box. If I keep everything inside it correctly sealed, then there's no reason the box couldn't also be sealed.
I can't believe the first phase of this project is finally starting to come to an end!
Also, I can ditch the 5 V regulator on the input to the Arduino, and just use the internal regulator.
Next actions:
Today I performed an experiment. A 3.3 m section of pipe leading up to a 8 drippers (~3.3 m higher than the pump), and a 4 m section of pipe leading to another 8 drippers (~1 m below the pump), were both connected to a T section and then to the pump/valve assembly. The pump and valve were run for 2 minutes. The pressure took 20 seconds to begin rising. After around 1:20, the pressure had stabilised at 4.5 PSI. After the pump was turned off, it took another 30 seconds or so to return to 0 PSI. The higher bucket collected around 0.37 L, and the lower bucket around 1.27 L. The first 20 seconds of pumping were presumably the lower pipe filling, and then the following minute was presumably the upper pipe section filling (slower due to lower pump speed under pressure, and the draining in the lower section). Following that, the last 30 seconds or so would be the water draining out of the bottom pump. Even if no water had drained from the bottom during the filling phase, then there would still be around 1.0 L in the pipe (13 mm diameter, 7.5 m long). Therefore, not all the water in the pipe went into the lower bucket, so there must be some left in the pipe. I better perform the test again.
Same again, but only 0:07 before pressure started to rise, stablising at 4.5 PSI after 0:50, and then only reaching 0 at 3:08, before the bottom end stopped dripping after 3:32. 0.56 L in the top, and 1.18 L in the bottom this time. I'll go for a longer test and check for linearity. Maybe 5 minutes? Perhaps an array of times. Plotted nicely to look for trends. I'm really hoping for similar gradients...
Next actions:
I bought another couple of water pumps, in case I decide to use 2 in series. I also bought 4 valves for a bidirectional water flow design.
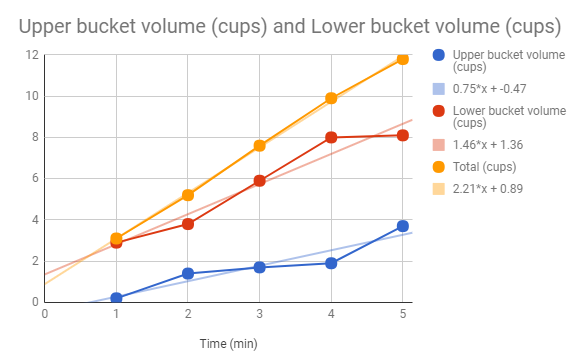
It looks like the upper bucket is getting roughly half as much water per minute as the bottom bucket, and that the water in the pipe accounts for around 0.6 L. This is loosly correct. The gradients aren't even close to similar.
The rough gist of it is that with 4.5 PSI at the pump, I'm getting 31 kPa. This is barely enough to climb to the high bucket in the first place. This experiment wasn't designed properly. Let's start again.
Assume that the pump is at the bottom (this will allow for pumping the water out in the future). Also assume that the bottom is in one of the corners. Then, at worst case, the opposite corner will be 2.8 m higher, which is approximately 28 kPa. The minimum acceptable pressure to ensure a maximum variation of around 56% flow rate is therefore, according to the graphs characterising the drippers, 13 - 41 kPa. But the pump is only providing 31 kPa, which is only enough to raise the water 1.8 m and still be above 13 kPa. The pump needs to be capable of producing at least 41 kPa. So, the pump needs to upgrade. The easiest way to do this would be to put 2 in series, theoretically generating around 62 kPa, which is sufficient. In practice, the pressure will drop as the flow rate increases, but I think it should skill be fine.
...but that pump is just NOT going to arrive on time. So, I'll need to make this work. Putting the tank on the top of the hill reduces the pressure requirements sufficiently, then I'll be dealing with higher pressures and therefore even better water distribution. Future versions can take advantage of the water being pumped out, in the meantime, I'll just try and make this work on the flat ground. So, 31 kPa is maybe around 2.5 L/hour. Let's just roll with this.
Some thinking today has resulted in probably just using the system as is for this version, but the next version should use valves at each tree in order to control the flow of water. The main costs here are the power distribution, and the increased economic cost, but the benefit is a controllable water output for each tree, calibrated by a potentiometer or similar. I'm thinking of a simple op amp circuit which uses an RC timer to turn the valve off after some amount of time. The resistor value could be chosen to adjust the time taken for the valve to close, which could be varied to line up with the variable flow rate at each height. Now at least there are no pumps to worry about, but the maximum power is a fair bit higher. It also relies on gravity itself, and forces the tank to be at the top. Though, I suppose, before the tank was simply forced to be at the bottom. It does add a lot of complexity to the design though, in that 16 circuits need to be made.
I've done such a terrible job of getting this ready. Even with the months and months of work, and tens of thousands of words, I still haven't managed to come up with something that works. Pretty dissapointing really. On the bright side, it isn't a trivial problem.
So, 2 potential solutions for the time being, now that "pooling" is established to be the biggest problem:
Time to give this project another kick in the guts. I think I have enough knowledge to make a start on this and fix it up as I go. I think the general premise - high pressure/low flow rate hooked up to a motorcycle bettery with a solar panel and pressure compensating drippers - is good. So, I need to buy an IBC. Then, I need to make the minimum possible product and iterate.
It looks like IBCs can be purchased in bulk from Perth. Maybe it's worth a trip in the truck. Maybe I'll drive up and pick up a bunch next weekend.
Next actions:
I bought the IBC locally. Now I need to pick it up and take it to the farm.
Next actions: